A Guide to the Android Studio Profiler
| Previous | Table of Contents | Next |
| An Android Instant App Tutorial | An Android Biometric Authentication Tutorial |
Introduced in Android Studio 3.0, the Android Profiler provides a way to monitor CPU, networking and memory metrics of an app in realtime as it is running on a device or emulator. This serves as an invaluable tool for performing tasks such as identifying performance bottlenecks in an app, checking that the app makes appropriate use of memory resources and ensuring that the app does not use excessive networking data bandwidth. This chapter will provide a guided tour of the Android Profiler so that you can begin to use it to monitor the behavior and performance of your own apps.
Accessing the Android Profiler
The Android Profiler appears in a tool window which may be launched either using the View -> Tool Windows -> Android Profiler menu option or via any of the usual toolbar options available for displaying Android Studio Tool windows. Once displayed, the Profiler Tool window will appear as illustrated in Figure 86-1:
In the above figure, no processes have been detected on any connected devices or currently running emulators. To see profiling information, an app will need to be launched. Before doing that, however, it may be necessary to configure the project to enable advanced profiling information to be collected.
Enabling Advanced Profiling
If the app is built using an SDK older than API 26, it will be necessary to build the app with some additional monitoring code inserted during compilation in order to be able to monitor all of the metrics supported by the Android Profiler. To enable advanced profiling, begin by editing the build configuration settings for the build target using the menu in the Android Studio toolbar shown in Figure 86-2:
Within the Run/Debug configuration dialog, select the Profiling tab and enable the Enable advanced profiling option before clicking on the Apply and OK buttons.
The Android Profiler Tool Window
An active Profiler tool window monitoring a running app is shown in Figure 86-3.
The Sessions panel (marked A) lists both the current profiling sessions and any other stored sessions performed since Android Studio was last launched. To the right of the Sessions panel is the live profiling window. The window will continue to scroll with the latest metrics unless it is paused using the Live button (B). Clicking on the button a second time will jump to the current time and resume scrolling. Horizontal scrolling is available for manually moving back and forth within the recorded time-line.
The top row of the window (C) is the event time-line and displays changes to the status of the app’s activities together with other events such as the user touching the screen, typing text or changing the device orientation. The bottom time-line (D) charts the elapsed time since the app was launched.
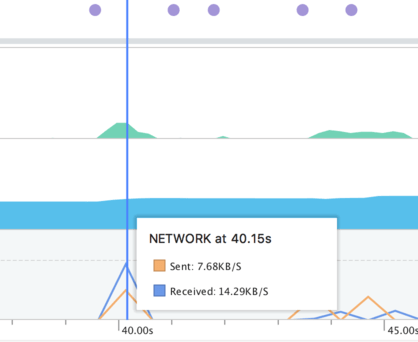
The remaining timelines show realtime data for CPU, memory, network and energy usage. Hovering the mouse pointer over any point in the time-line (without clicking) will display additional information similar to that shown in Figure 86-4.
Clicking within the CPU, memory, networking or energy timelines will display the corresponding profiler window, each of which will be explored in the remainder of this chapter.
The Sessions Panel
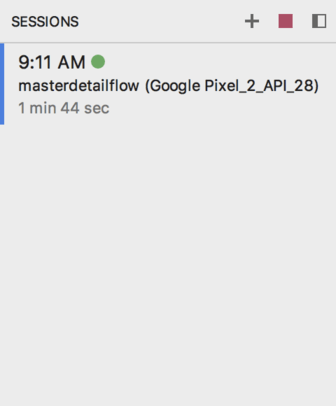
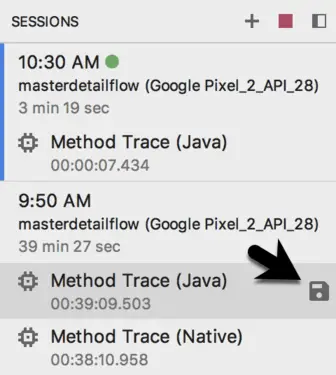
When an app is running and the Profiler tool window displayed, the profiler will automatically attached to the app and begin profiling. An entry showing the app name, the device or emulator on which it is running and the start time will appear in the Sessions panel as shown in Figure 86-5. The green circle next to the time indicates a currently active profiling session. Pressing the red stop button will end the current session but the data and graphs will remain available for browsing until Android Studio exits. Additional profiling sessions can be started by clicking on the + button and selecting the device and app:
The green circle next to the time indicates a currently active profiling session. Pressing the red stop button will end the current session but the data and graphs will remain available for browsing until Android Studio exits. Additional profiling sessions can be started by clicking on the + button and selecting the device and app:
The Load from file... menu option allows a CPU trace previously saved from within the CPU profiler to be loaded into the Profiler for inspection.
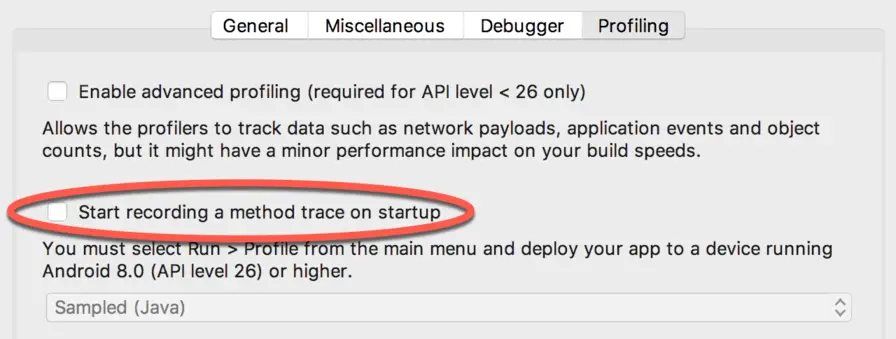
To automatically start profiling for an app when it launches (as opposed manually starting a profiler session after the app has launched), begin by opening the Run / Debug Configurations dialog as outlined in Figure 86-2 above.
From within the dialog, select the Profiling screen and enable the Start recording a method trace on startup option:
The CPU Profiler
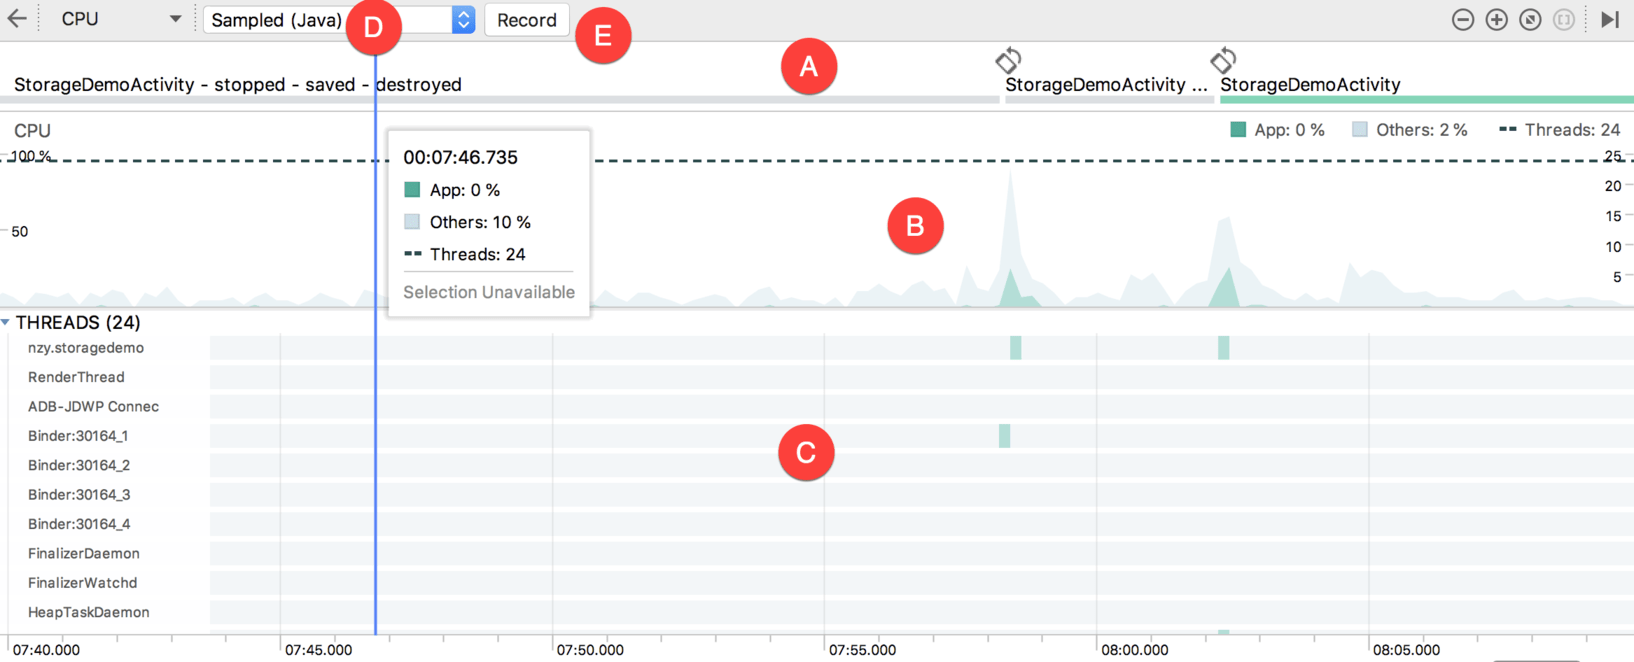
When displayed, the CPU Profiler window will appear as shown in Figure 86-8. As with the main window, the data is displayed in realtime including the event time-line (A) and a scrolling graph showing CPU usage (B) in realtime for both the current app and a combined total for all other processes on the device:
Located beneath the graph is a list of all of the threads associated with the current app (C). Referred to as the thread activity timeline, this also takes the form of a scrolling time-line displaying the status of each thread as represented by colored blocks (green for active, yellow for active but waiting for a disk or network I/O operation to complete or gray if the thread is currently sleeping).
The CPU Profiler supports two types of method tracing (in other words profiling individual methods within the running app). The current tracing type, either sampled or instrumented, is selected using the menu marked D. The tracing types can be summarized as follows:
- Sampled (Java) – Captures the method call stack at frequent intervals to collect tracing data for Java code execution. While less invasive than instrumented tracing, sampled tracing can miss method calls if they occur during the intervals between captures. Snapshot frequency may be changed by selecting the Edit configurations… button within the type selection menu and creating new custom trace types.
- Instrumented (Java) – Traces the beginning and ending of all Java method calls performed within the running app. This has the advantage that no method calls are missed during profiling, but may impact app performance due to the overhead of tracing all method calls, resulting in misleading performance data.
- Sampled (Native) - Captures the method call stack at frequent intervals to collect tracing data for native (for example C or C++) code execution within the app.
- System Trace - Profiles the system level CPU and thread activity on the device while the app is running (in other words CPU activity occurring outside the app process).
The trace results may be viewed in Top Down, Bottom Up, Call Chart and Flame Chart modes, each of which can be summarized as follows:
- Top Down – Displays the methods called during the trace period in a hierarchical format. Selecting a method will unfold the next level of the hierarchy and display any methods called by that method:
* Bottom Up – Displays an inverted hierarchical list of methods called during the trace period. Selecting a method displays the list of methods that called the selected method:

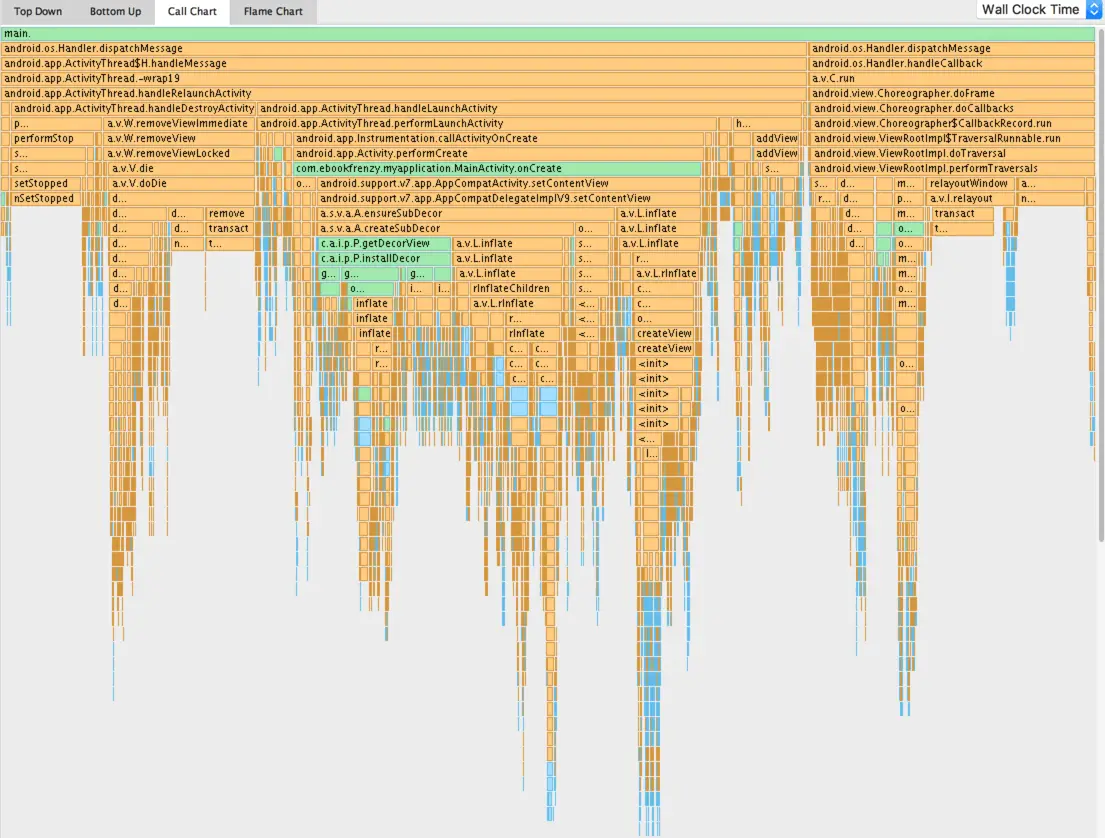
- Call Chart – Provides a graphical representation of the method trace list where the horizontal axis represents the start, end and duration of the method calls. In the vertical axis, each row represents methods called by the method above. Methods contained within the app are colored green, API methods orange and third-party methods appear in blue:
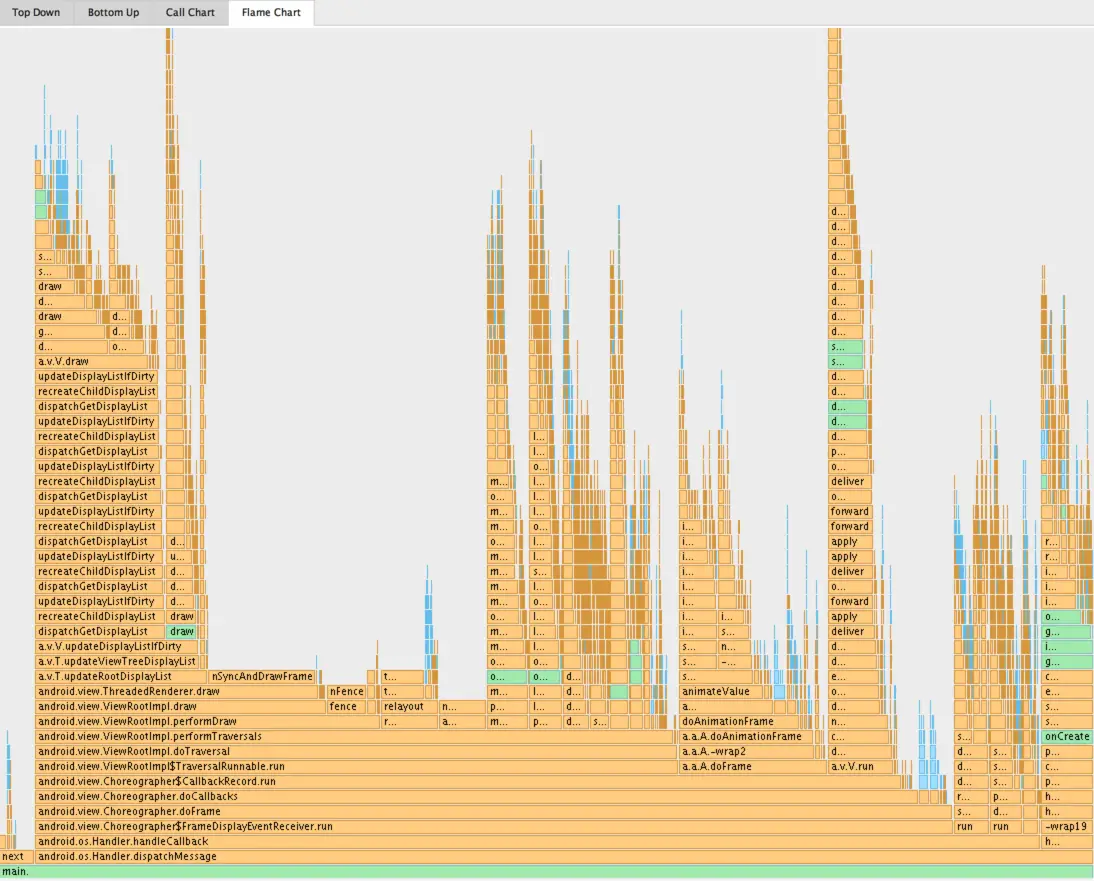
- Flame Chart – Provides an inverted graphical representation method trace list where each method is sized on the horizontal axis based on the amount of time the method was executing relative to other methods. Wider entries within the chart represent methods that used the most execution time relative to the other methods making it easy to identify which methods are taking the most time to complete. Note that method calls that have matching call stacks (in other words situations where the method was called repeatedly as the result of the same sequence of preceding method calls) are combined in this view to provide an overall representation of the method’s performance during the trace period:
Right-clicking on a method entry in any of the above views provides the option to open the source code for the method in a code editing window.
Memory Profiler
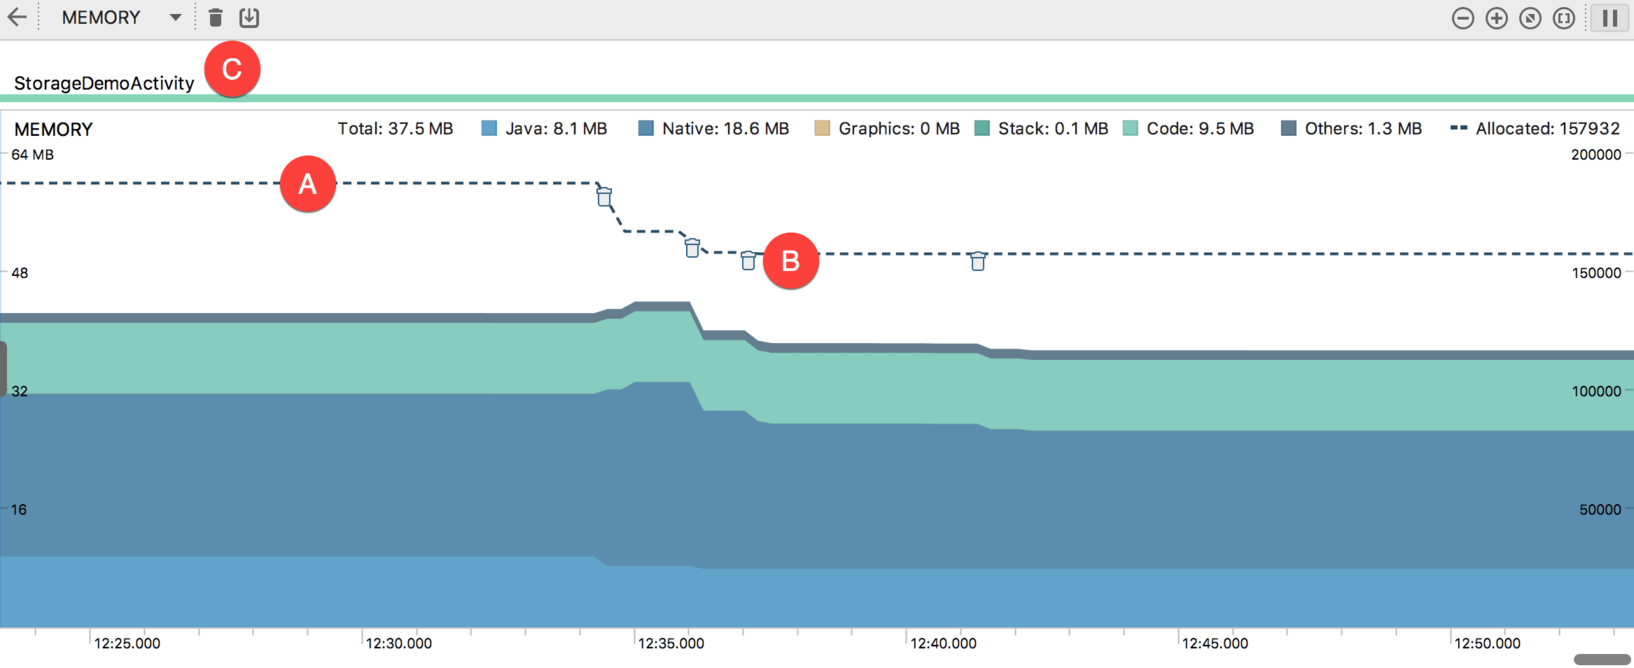
The memory profiler is displayed when the memory time-line is clicked within the main Android Profiler Tool window and appears as shown in Figure 86-14:
The memory time-line shows memory allocations relative to the scale on the right-hand side of the time-line for a range of different categories as indicated by the color key. The dashed line (A) represents the number of objects allocated for the app relative to the scale on the left-hand side of the time-line graph.
The trash can icons (B) indicate garbage collection events. A garbage collection event occurs when the Android runtime decides that an object residing in memory is no longer needed and automatically removes it to free memory.
In addition to the usual timelines, the window includes buttons (C) to force garbage collection events and to capture a heap dump.
A heap dump (Figure 86-15) lists all of the objects within the app that were using memory at the time the dump was performed showing the number of instances of the object in the heap (allocation count), the size of all instances of the object (shallow size) and the total amount of memory being held by the Android runtime system for those objects (retained size).
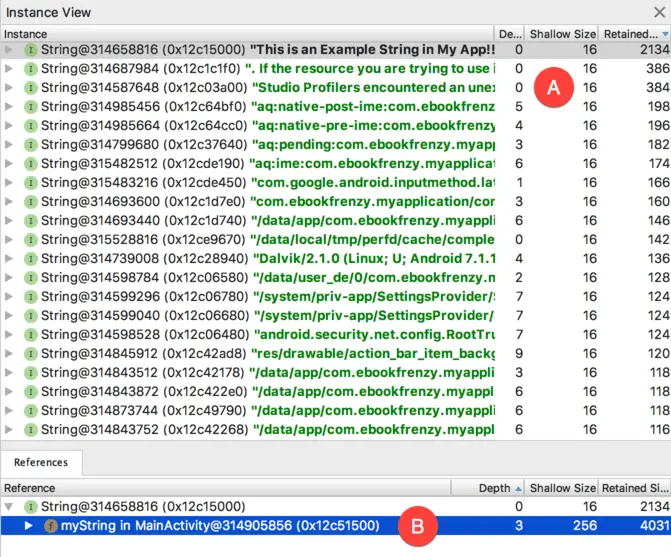
Double clicking on an object in the heap list will display the Instance View panel (marked A in Figure 86-16) displaying a list of instances of the object within the app. Selecting an instance from the list will display the References panel (B) listing where the object is referenced. Figure 86-16, for example shows that a String instance has been selected and is listed as being referenced by a variable named myString located in the MainActivity class of the app:
Right-clicking on the reference would provide the option to go to the MainActivity class in the heap list, or jump to the source code for that class.
Network Profiler
The Network Profiler is the least complex of the tools provided by the Android Profiler. When selected the Network tool window appears as shown in Figure 86-17:
In common with the other profiler windows, the Network Profiler window includes an event time-line. The Radio time-line (marked A in Figure 86-17) shows the power status of the radio relative to the Wi-Fi connection if one is available.
The time-line graph (B) includes sent and received data and a count of the number of current connections. At time of writing, the Network Profiler is only able to monitor network activity performed as a result of HttpURLConnection and OkHttp based connections.
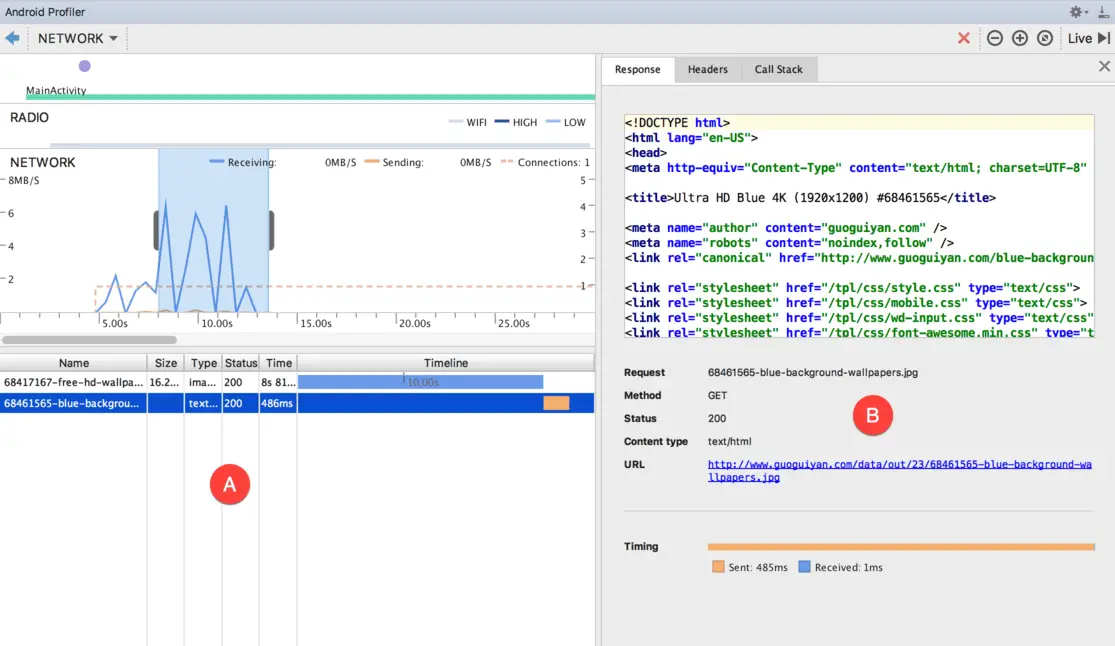
To view information about the files sent or received, click and drag on the time-line to select a period of time. On completing the selection, the panel labeled A in Figure 86-18 will appear listing the files. Selecting a file from the list will display the detail panel (B) from which additional information is available including response, header and call stack information:
Energy Profiler
The energy profiler (Figure 86-19) provides a realtime analysis of the energy used by the currently running app categorized in terms of CPU, networking and location tracking activity.
The Energy profiler includes an event timeline (A) and a graph indicating the current energy usage (B). The graph is colored based on the key (C) which also indicates the current energy usage levels of the three categories. Selecting a section of the graph will list any system processes that are contributing to excessive energy use such as alarms and jobs, location requests or wake locks.
Summary
The Android Profiler monitors the CPU, memory, network and energy resource usage of apps in realtime providing a visual environment in which to locate memory leaks, performance problems and the excessive or inefficient battery use or transmission of data over network connections. Consisting of different profiler views, the Android Profile allows detailed metrics to be monitored, recorded and analyzed.
| Previous | Table of Contents | Next |
| An Android Instant App Tutorial | An Android Biometric Authentication Tutorial |


