An Overview of the Firebase Analytics Screens
| Previous | Table of Contents | Next |
| A Guided Tour of the Firebase Analytics Dashboard | A Firebase Analytics Tutorial |
The previous chapter provided an overview of the Firebase Analytics Dashboard screen. In addition to the dashboard, the Firebase console also provides other screens that provide more detail on each metric. This chapter will provide an overview of these screens and explain how each fits into the Firebase Analytics system.
Note that many of these screens provide the same filtering and date range options available within the dashboard screen for the purpose of reviewing different time periods or for comparing one date range against another.
The Events Screen
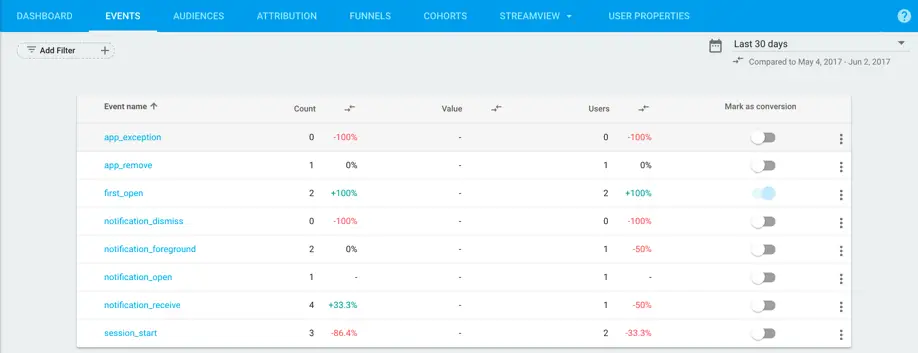
Clicking on the Events tab located in the analytics toolbar will display the screen shown in Figure 40‑1:
Figure 40‑1
The table presented on the Events screen lists all of the events that have been triggered by the app in the designated date range. This will include both those events that are automatically recorded by Firebase Analytics and any custom events configured for the app.
The table includes columns for the event name, the number of times the event triggered and the number of users who triggered the event together with comparison percentages.
If an event has a value parameter, the value column will list the total accumulated value amount for the corresponding event.
The switches in the Mark as conversion column indicate whether the event is to count as a conversion, a topic which will be covered when discussing attributions later in this chapter.
Clicking on the menu icon in the far right column allows any parameters assigned to the event to be edited.
Selecting an event from the list will display a detail screen showing additional information about the event statistics including an event timeline, location information, user demographics and events per session.
The Audiences Screen
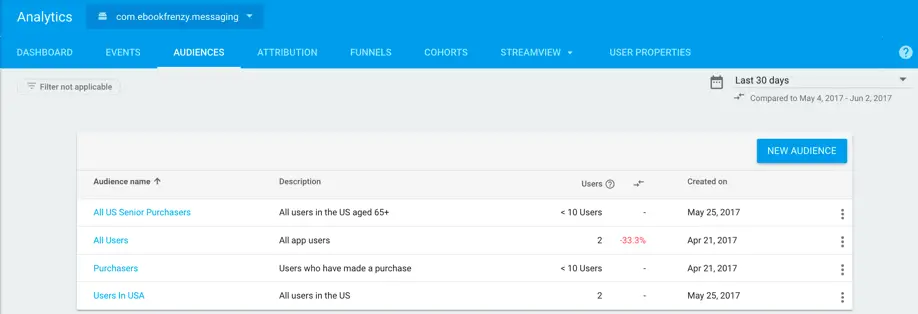
The Audiences screen allows audiences to be viewed, created and managed. Firebase Analytics audiences are groups of users with something in common. Audiences can be created based on user properties (such as geographical location, age, device type or language) or on events. An audience could, for example, be created to contain all users that have made in in-app purchase, or triggered a custom event with a specific value.
Figure 40‑2
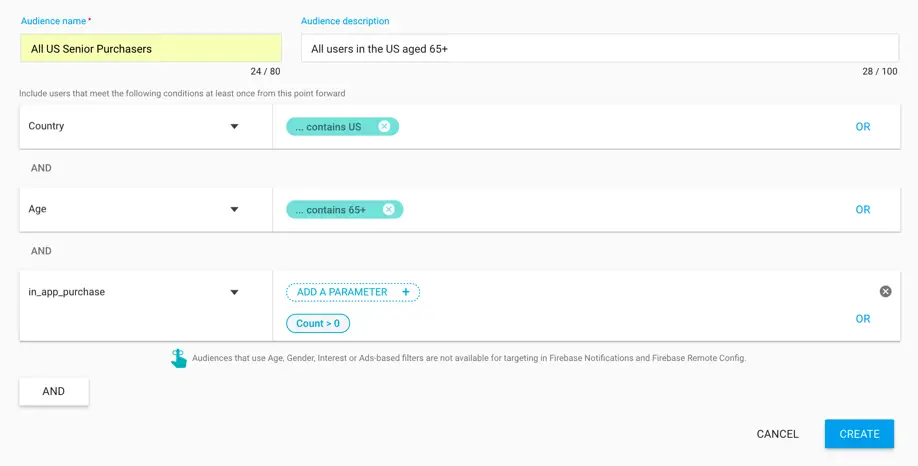
By default, only the built-in All Users and Purchaser audiences will be available. To add an audience, click on the New Audience button. In the resulting dialog (Figure 40‑3), enter a name and description for the audience, then select the events or user properties by which the audience is to be identified.
Figure 40‑3
Within the new audience dialog, the AND and OR buttons can be used to create audiences based on multiple conditions. An audience could, for example, be created to contain all male French users who have made an in-app purchase greater than a specified value and are either in the 25-34 age range, or over the age of 65.
Clicking on an audience name in the table will display a detail screen containing the standard analytics metrics for that audience. Clicking on the menu button in the far right column provides the option to add the metrics for that audience to the Analytics Dashboard screen.
Once an audience has been created it can be used in a variety of ways, for example both Firebase Notifications and Remote Config updates can be targeted to audiences created on this screen.
The Attribution Screen
The Attribution screen provides a way to track the effectiveness of marketing campaigns (typically advertising) designed to acquire new users and encourage them to engage with the app. When a user takes an action as a result of a marketing campaign (such as installing the app or making an in-app purchase), this is referred to as a conversion. By default, Firebase considers a first_open event to be a conversion if it can be associated as having come from an advertising network. To make other events count as conversions, switch to the Events screen, locate the event in the list and turn on the switch in the Mark as conversion column.
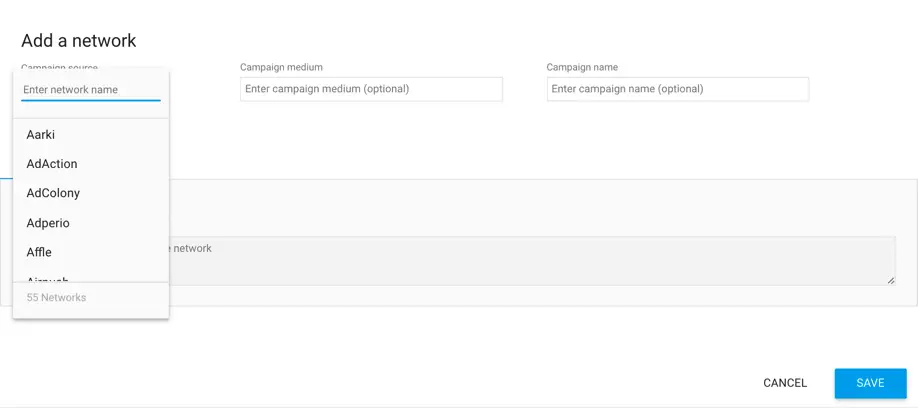
To associate advertising campaigns with conversion tracking, click on the Network Settings tab shown in Figure 40‑4:
Figure 40‑4
Within this screen, clicking on the Campaign source menu will provide a list of ad networks from which a selection can be made. Once the ad network on which the advertisements are going to run has been selected, copy the campaign URL and paste it into the campaign settings within the ad network’s own portal.
Figure 40‑5
When a conversion event is triggered via a campaign URL, it will be recorded within the Attribution metrics and attributed to the ad network.
In addition to the ad networks listed in the Network Setting screen, a Google AdWords account may be linked with Firebase Analytics for tracking conversions. To link the account, scroll down within the Network Settings screen and click on the Configure AdWords conversion tracking link.
Once linked, conversion tracking can be configured for AdWords campaigns by clicking on the Configure AdWords conversion tracking link within the Network Settings screen.
The Funnels Screen
The term funnel refers to a series of steps taken by a user within a website or app. A user might, for example, browse through a list of items within an app, select an item of interest, click on an add to cart button and then proceed through the process of entering shipping and payment info before finally making the purchase. If each of these steps is associated with an event, a funnel can be defined within Firebase Analytics and then used to track how users progress through the funnel. This can be particularly useful for identifying the point at which users frequently stop progressing through the steps so that corrective action can be taken or app design changes made (for example making a particular screen more user friendly or by requiring less information from the user to complete the step).
To create a funnel, go to the Funnels screen and click in the Add your first funnel button. In the new funnel dialog, enter a name and description for the funnel, then add two or more events to make up the funnel.
Figure 40‑6
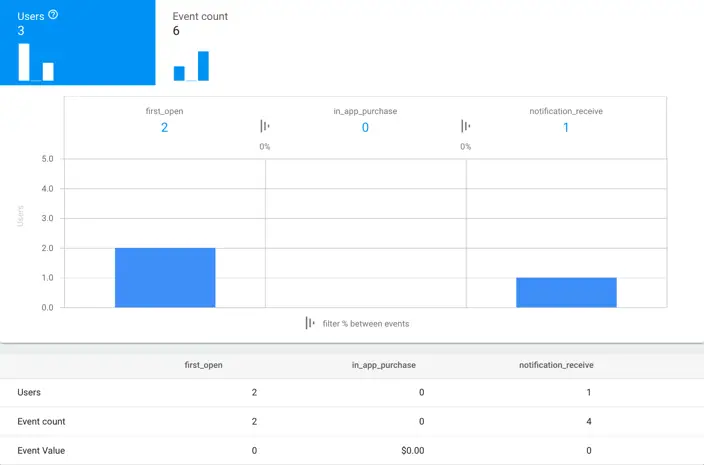
The funnels screen will list all configured funnels. Clicking on a funnel will display stats for each step of the funnel providing insight into user behavior and highlighting steps where users appear to stop and give up:
Figure 40‑7
The Cohorts Screen
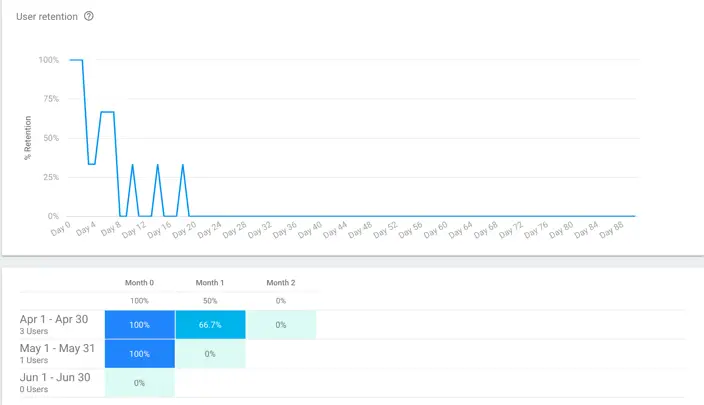
The cohorts screen essentially displays the same information as the Retention cohorts card located in the Firebase Analytics Dashboard with the addition of an extra line graph. As with the dashboard, this screen shows the level of retention for groups of users that began using the app at the same time.
Figure 40‑8
The StreamView Screen
The StreamView screen provides a live view of the events that are taking place within the installed app base.
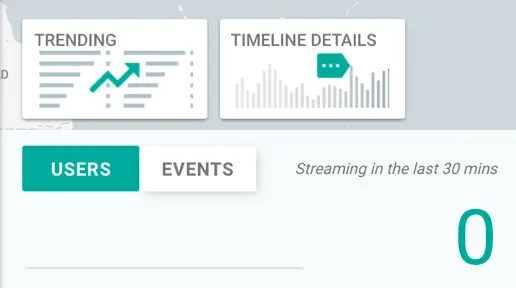
The live view consists of a map on which either users or events are displayed. The display can be switched between event and user modes by clicking on one of the two buttons shown in Figure 40‑9:
Figure 40‑9
Timeline details and a trending table are also available by hovering the mouse pointer above the toggle buttons and clicking on one of the two thumbnail panels that appear:
Figure 40‑10
The DebugView Screen
In the real world, Firebase Analytics only gathers data from user devices approximately once an hour. Clearly this would make testing a slow process during development since every code change will require a wait of up to an hour to see the results. In recognition of this issue, Google provides the DebugView screen.
DebugView is accessed by clicking on the StreamView tab and selecting DebugView from the drop-down menu as shown in Figure 40‑11:
Figure 40‑11
Before events will appear within the DebugView, the device on which testing is to be performed must be switched into Analytics Debug mode. This involves attaching the device to, or running an emulator on a development system on which the adb tool is available and then running the following command in a command-prompt or terminal window (where <package name> is replaced by the package name of the app being tested):
adb shell setprop debug.firebase.analytics.app <package_name>
Analytics Debug mode should be disabled after testing is complete by running the following command:
adb shell setprop debug.firebase.analytics.app .none.
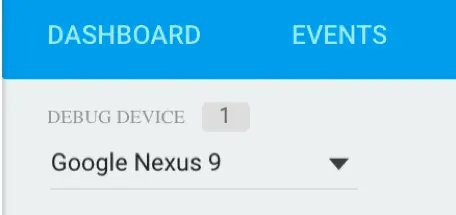
Once enabled, the events will begin appearing a short time after they occur within the app. If multiple devices are being used to generate app analytics events, the device selector in the top left-hand corner of the screen can be used to select the device for which stats are to be displayed within the DebugView:
Figure 40‑12
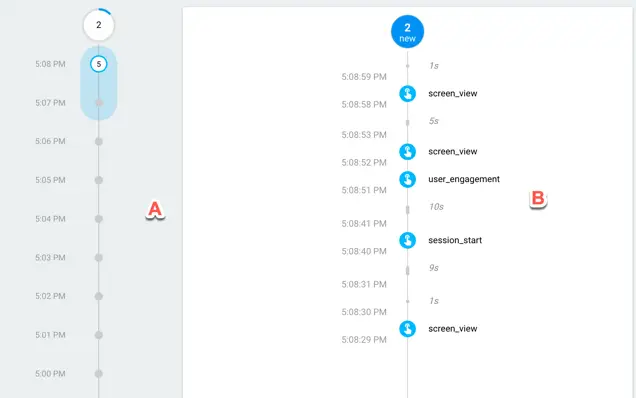
The main panel of the DebugView provides two streams of data. In the minutes stream (marked A in Figure 40‑13), each circle represents a minute of time over a 30 minute time period. The number displayed within the circle indicates the number of events that occurred during that minute and clicking on the circle reveals the timeline of events during that 60 second time period within the seconds stream (B):
Figure 40‑13
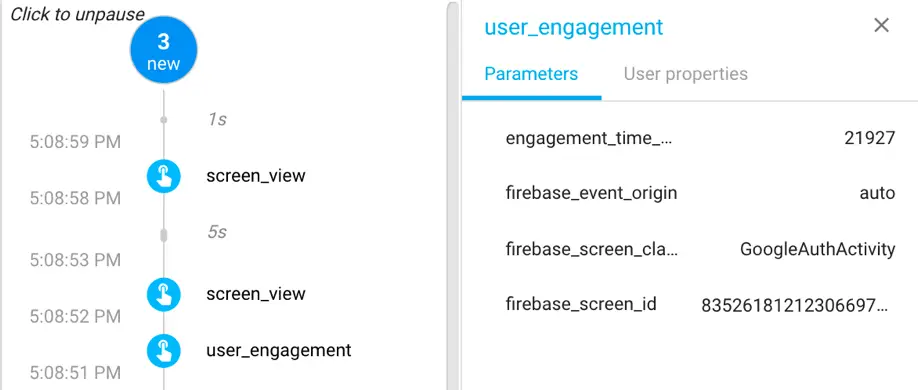
Clicking on an event in the seconds stream will display information about the event including parameters associated with the event:
Figure 40‑14
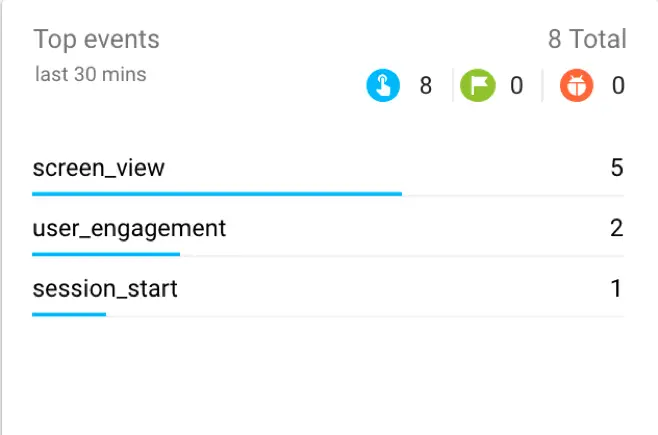
The screen also contains a Top Events card (Figure 40‑15) listing the most frequent events captured during the current 30 minute period. Clicking on an event from the list will display a detailed analysis of all instances of that event over a 30 minute time window:
Figure 40‑15
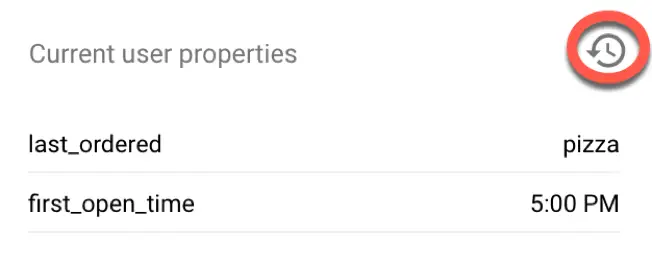
Finally, the current user properties panel lists the current set of user properties as configured by the app on the test device.
Figure 40‑16
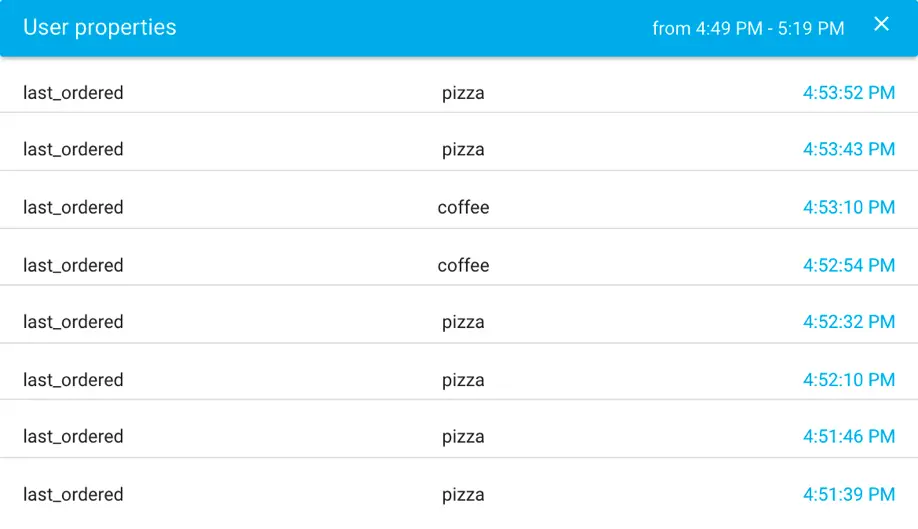
Clicking on the time button (highlighted in Figure 40‑16 above) will display a history of the changes to the values of the listed properties over the preceding 30 minutes:
Figure 40‑17
User Properties Screen
As described in the previous chapters, user properties provide a way for an app to provide user specific information along with each event that is logged. Once configured, user properties are then used when filtering results or building audiences within the Firebase console.
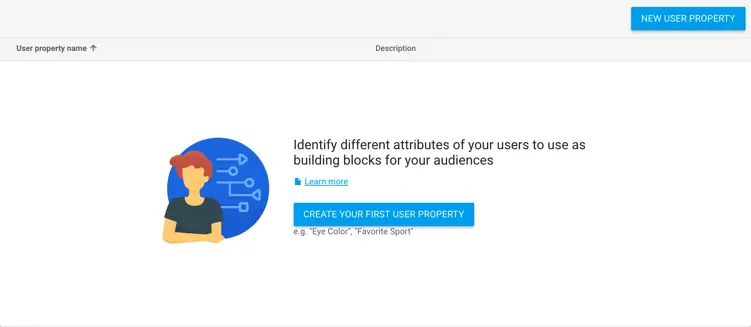
User properties are created and updated in code but are not available for filtering within Firebase Analytics until they have been registered within the User Properties screen. To register a user property click on the User Properties tab and click on the New User Property button:
Figure 40‑18
In the resulting dialog, simply enter the property name as implemented in the app code together with a description and click on the Create button.
Summary
In addition to the Analytics Dashboard, the Firebase console also includes eight other screens containing detailed information relating to metrics such as events, audiences, user retention and user engagement. Screens are also provided for creating audiences and building funnels to track user progress through predefined sequences of steps within an app.
| Previous | Table of Contents | Next |
| A Guided Tour of the Firebase Analytics Dashboard | A Firebase Analytics Tutorial |
